October 6, 2022
Maven Pizza Challenge
Full challenge details - Introducing the Maven Pizza Challenge.
Link to GitHub repository, including data and final output.
About the dataset
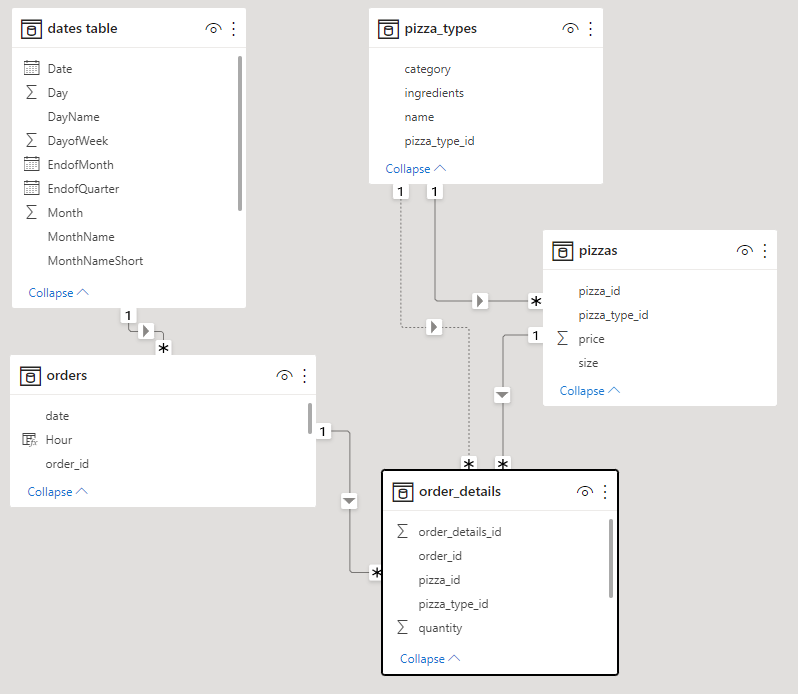
This dataset contains 4 tables in CSV format.
The Orders table contains the date & time that all table orders were placed.
The Order Details table contains the different pizzas served with each order in the Orders table, and their quantities.
The Pizzas table contains the size and price for each distinct pizza in the Order Details table, as well as its broader pizza type.
The Pizza Types table contains details on the pizza types in the Pizzas table, including their name as it appears on the menu, the category it falls under, and its list of ingredients.
How to play the Maven Pizza Challenge
For the Maven Pizza Challenge, I will be playing the role of a BI Consultant hired by Plato's Pizza, a Greek-inspired pizza place in New Jersey. I have been hired to help the restaurant use data to improve operations.
Here are some questions that I've been given by the owner:
What days and times do we tend to be busiest?
How many pizzas are we making during peak periods?
What are our best and worst selling pizzas?
What's our average order value?
How well are we utilizing our seating capacity? (we have 15 tables and 60 seats)
Import tables
Load each CSV file to Power BI
The data model is automatically created - check the relationship between the tables
Connect a date table
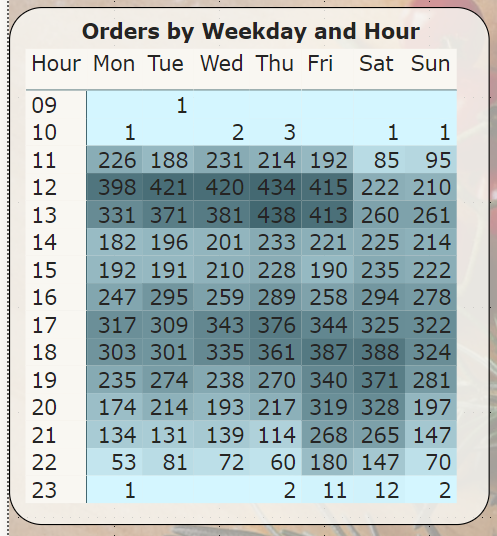
What days and times do we tend to be busiest? See below
How many pizzas are we making during peak periods?
Visualisation - Matrix
Rows: create a custom column in the Orders table, extracting the hour of the orders
Column: Weekday Name
Value: order_details[quanity]
Format: conditional formatting the values to create the heat map
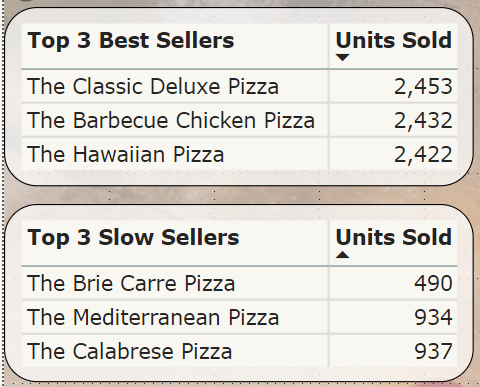
What are our best and worst-selling pizzas?
Best Seller: Visualisation - Table
1st column: pizza_type[name]
Rename the column to ‘Top 3 Best Sellers'
Filter for this visualisation: top N => top 3 => by order_details[quantity]
The best seller is the name with the most quantity
2nd column: order_details[quantity]
Rename column to ‘Units Sold’
Sort from largest to smallest
Worst Seller: Copy + Paste the visualisation from above
Rename column to ‘Top 3 Worst Sellers’ (rename for this viz)
Filter for this visualisation: top N => bottom 3 => by order_details[quantity]
The worst seller is the name with the least quantity
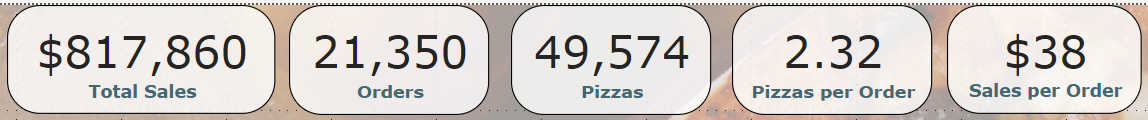
What's our average order value?
Visualisations - Cards
Total Sales: New MeasureTotal Sales = SUMX(
order_details,
order_details[quantity] *
RELATED(pizzas[price])
)
Total Order: Max of order_details[order_id]
Total Pizzas: Sum of order_details[quantity]
Pizzas per order: New MeasurePizzas per Order = DIVIDE(
SUM('order_details'[quantity]),
COUNTA('orders'[order_id])
)
Sales per order: New MeasureSales per Order = DIVIDE(
[Total Sales],
COUNTA('orders'[order_id])
)
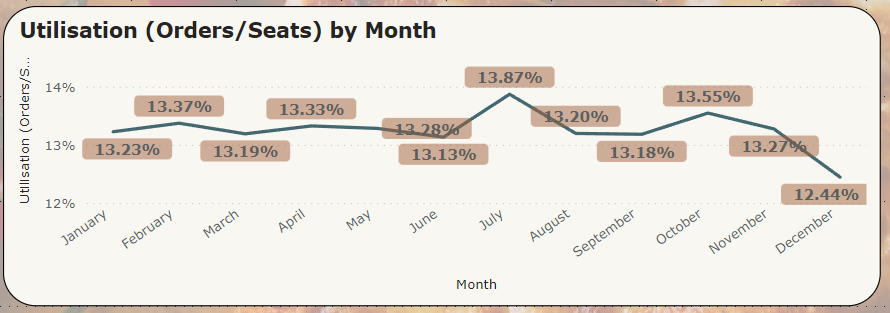
How well are we utilizing our seating capacity? (15 tables and 60 seats)
Assumptions: daily capacity is 15 tables * 4 chairs * 15 business hours = 900 units; 2 customers enjoy 1 order, taking 2 chairs, finishing the order in 1 hr (hence, 1 order takes 2 units of capacity)
Create a Capacity table
Duplicate the Orders table
Remove duplicated values Date column
Remove all other columns
Create a new column and assign 900 as the values
Value: New MeasureUtilisation (Orders/Seats) = DIVIDE(
COUNTA('orders'[order_id]) * 2,
SUM('capacity'[Index])
)
Other useful information
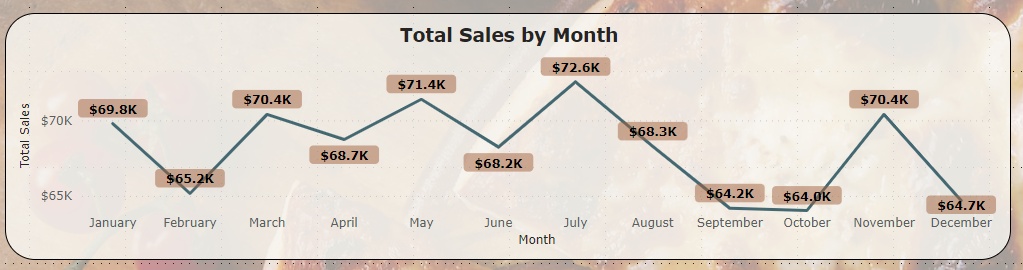
Sales by month
Visualisation - Line chart
X-axis: Month of date table
Y-axis: total sales
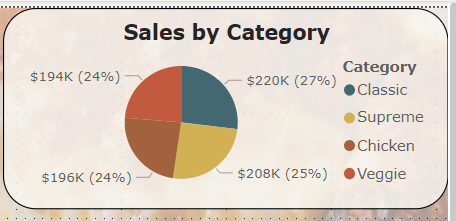
Sales by category
Visualisation - Pie chart
Legend: pizza_types[category]
Values: total sales
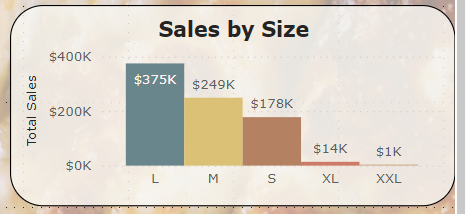
Sales by size
Visualisation - Column chart
X-axis: pizza_types[category]
Values: total sales
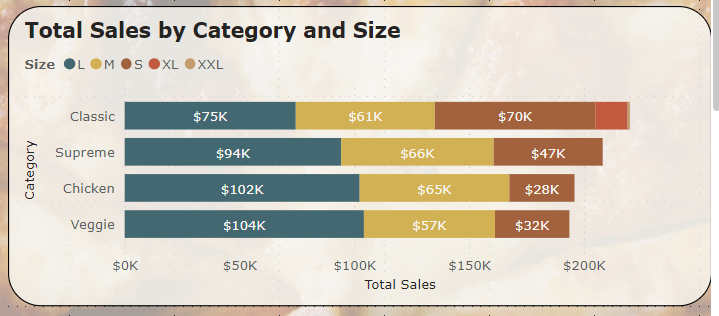
Sales by category and size
Visualisation - Stacked bar chart
Y-axis: pizza_types[category]
X-axis: total sales
Legend: pizzas[szie]
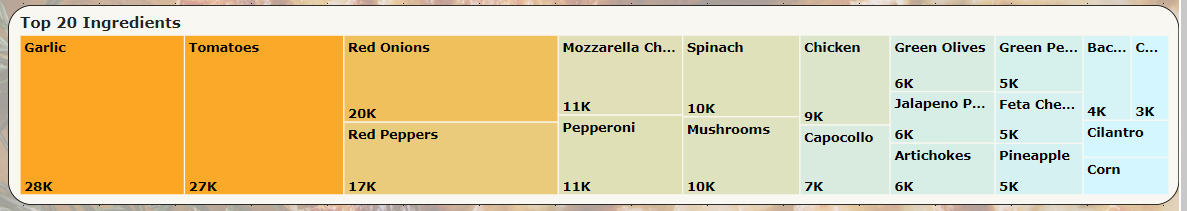
Most used ingredients
New table - ingredients
Duplicate the order_details table
Add a new column extracting the pizza_type_id by removing the size in the pizza_id column
Merge as a new table with the pizza_types table via pizza_type_id column
Expand the ingredients column only
Delimit the ingredients column using “, “ as the delimiter
Remove all columns except the quantity and ingredient column
Select quantity column, pivot other columns - rename the new column to ingredients
Visualisation - Treemap
Category: ingredients
Values: sum of quantity
Findings and Recommendations
The top 3 best-sellers are not too far apart but the slowest seller (Brie Carre) is only half the second lowest one.
Recommendation: Remove the Brie Carre due to low volume, and also reduce the complexity of inventory management.
Three peak periods during a week: weekday lunches; weekday dinners; the evening of Friday and Saturday. Peak selling periods conincide with national holidays.
Recommendation: Need to ensure appropriate staffing during these periods.
There are insignificant orders before 11 am and after 22 pm.
Recommendation: Reduce trading hours to 11 am to 22 pm to reduce costs.
The utilisation rate is very low, hovering around 13%.
Recommendation: Run marketing campaigns to attract more customers or rearrange the underutilised areas for other purposes.
The average order size is 2.32 per pizza.
Recommendation: Typical customers are likely to be ordered by couples or families, hence, focus on these groups of customers during advertising.
Almost no order in XL and XXL size while L size takes 45% of total sales.
Recommendation: Do not remove XL and XXL sizes, they act as distractions, so people will order L-size pizzas, the biggest revenue generator.
There are great differences in volume of most used and least used ingredients.
Recommendation: Seek bulk discounts where possible on the most commonly used ingredients, while removing pizza associated with the least used ingredients for better inventory management.